

By Justin Chandler
Twitter is giving Ryerson researchers insight into the upcoming federal election. Ryerson’s Social Media Lab analyzes tweets with online tool PoliDashboard “to gauge the pulse” of the election.
“PoliDashboard shows what people are discussing, feel passionate about and feel is controversial,” said Shawn Menzies, research assistant for the lab and graduate of Ryerson’s business and technology management program.
Twitter is “our digital town square,” said Philip Mai, research and communications manager for the Social Media Lab. “As social researchers, we want to go to where the people are, and the people are online.”
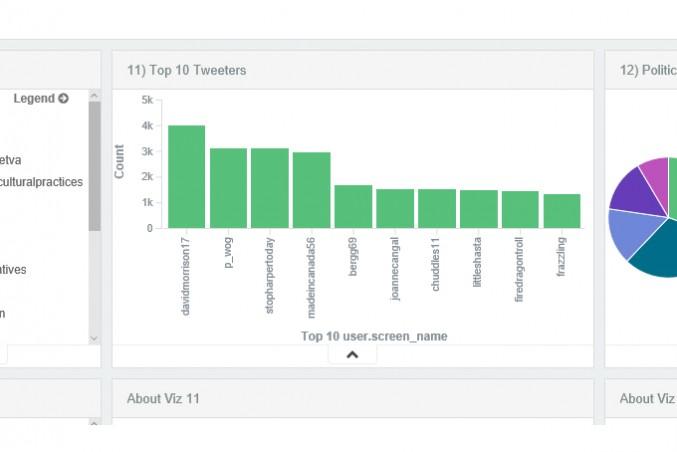
By analyzing tweets that use the hashtag #CDNpoli and #Elxn42, PoliDashboard shows which issues and politicians Twitter users discuss. It updates in real-time and presents data from the last seven days. The tool is currently analyzing about 549,000 tweets. PoliDashboard runs on a software stack of three components. One collects tweets, one indexes them and another visualizes the data. It went live on Sept. 15 and is monitored and maintained by three researchers in the Social Media Lab.
Mai said the lab decided to limit displayed data to seven days in order to make it “more palatable and more digestible.” He said the lab can examine the entirety of the data they collect.
“[PoliDashboard] shows what people [were] thinking over the past week,” Mai said. “You can see that the conversation is changing. Different topics are coming to the forefront. Other topics disappear into the background.”
The Trans-Pacific Partnership (TPP) trade agreement became the most-tweeted-about topic after it was reached on Oct. 5, Mai said. PoliDashboard collected roughly 35,000 tweets about the TPP since Sept. 30.
The word “niqab” has been mentioned in about 25,000 of the collected tweets since Sept. 30. Menzies said the niqab has become a more popular topic in the past few days, likely because of the Conservative Party’s attempts to ban women taking the citizenship oath from wearing it.
Menzies said a pie chart measuring the political leanings of analyzed Twitter users is one of PoliDashboard’s most interesting visualizations. Users are categorized as liberal, conservative, green, progressive or independent, depending on their Twitter bios. About 32 per cent of users are labelled conservative and about 31 per cent as liberal. About 15 per cent of users are labeled progressive, the same amount as those labeled green. About nine per cent are measured as independent.
“Conservatives take up a solid third, but you can actually see that liberals, progressives and those that identify themselves as green [outnumber the conservatives]. If you put them together as the left-leaning side of the graph, they would easily overtake them and form government,” Menzies said. “It is very illustrative of the actual vote breakdown.”
PoliDashboard also tracks the amount of times party leaders are mentioned in the tweets it analyzes. Currently, Conservative Prime Minister Stephen Harper is the most-mentioned, followed by Liberal Party Leader Justin Trudeau, NDP Leader Tom Mulcair then Green Party leader Elizabeth May. The tool also tracks where leaders are mentioned the most. Harper is the most-mentioned leader in every province, except for the Northwest Territories, where May is mentioned in about 57 per cent of the tweets.
By filtering tweets with politicians’ names then measuring co-occurring terms, PoliDashboard can show what and who is discussed in conjunction with the party leaders. Right now, the top three words associated with Harper are TPP, vote and Trudeau.
Mai said one can determine which leaders Twitter users see as natural enemies, by looking at which leader’s names show up together. About 18 per cent of analyzed tweets that mention Trudeau also mention Harper.
Another graph shows the number of tweets collected by hour over the past week. There is a significant spike that coincides with the most recent leader’s debate on Oct. 2, but that debate caused the lowest spike of all the debates so far, Menzies said.
“Going into this, we had the preconception that user engagement would increase after each debate,” Menzies said. “But it has actually gone down.”
Mai said the number of tweets sent during debates has continually dropped, because many of the debates have been inaccessible. Many people tweeted just to ask where they could watch debates.
Next week, the Social Media Lab plans to launch a similar dashboard to measure tweets about the Toronto Blue Jays. After that, they want to make a dashboard for the American federal election.


NBA 2K17 MT PC
this website might help me personally to find good quality suggestions!